Stand at the same machine on two different shifts and you can watch it happen. Same part number, same control plan, same material lot. Two operators. Two parts that are not quite the same. The dimensions pass, so nobody calls it a problem. But the cycle time is different, the surface is different, and over a quarter the scrap rate on one shift is quietly double the other.
The instinct is to blame the people. The better operator is just better. That explanation is comfortable and it is wrong. The two operators are not the variable. The two procedures they are running are the variable, and one of those procedures is not written down anywhere.
The control plan defines a window, not a winner
Here is the part that gets missed. A control plan and an SOP do not tell an operator exactly what to do. They tell the operator the acceptable range. Run the cell somewhere between 1,400 and 1,460 degrees. Hold pressure within a band. Keep feed rate inside a tolerance.
Inside that window, every experienced operator has found their own number. Not randomly. They found it the hard way, through a bad lot in 2023, through a tip from the lead who retired, through three years of watching what the machine does when the humidity climbs. Each of those numbers is a small, hard-won piece of process knowledge. And each of them is invisible to the document, because the document only ever specified the range.
So you do not have one process with some operator noise on top. You have three or four genuinely different processes, each tuned by a different person, all hiding inside one control plan that calls them identical.
A 2026 review of manufacturing variability put it as plainly as I have seen it stated: the single largest source of process variation is operators setting different machine parameters because, in their experience, “it runs better that way” (Fabrico). That is not indiscipline. It is undocumented expertise. And it is the reason your best part is being produced by accident, on one shift, by one person who may not be in tomorrow.
Why this is expensive even when every part passes
The cost does not show up as a failed part. It shows up as a band. Your first-pass yield wobbles shift to shift. Your cycle time has a range instead of a number. Your scrap rate has a “good shift” and a “bad shift” that nobody can fully explain, because the explanation is sitting on three different clipboards.
First-pass yield is the metric the industry has rallied around in 2026, and rightly so: the strongest operations run above 98% first-pass on mature products, and they get there through systematic measurement, not heroics (Veryable). But you cannot systematically improve a process you have not actually captured. If three operators are running three setpoints, your first-pass yield is an average of three different processes. Improving the average is guesswork until you know which underlying process is the good one.
This is also why digitizing the SOP, on its own, does not fix it. The whole category is racing to put procedures on tablets, add photos, add video, show only the current revision. All useful. None of it captures the winning setpoint if the winning setpoint was never written down in the first place. You will have digitized the window and left the winner on the clipboard.
Run this on your floor this week
You do not need a project or a budget to find out whether you have this problem. You need one part number and about a shift’s worth of attention. Here is the protocol I use.
- Pick one part number that runs across more than one shift or more than one operator. Choose one that matters, where scrap or rework actually costs you.
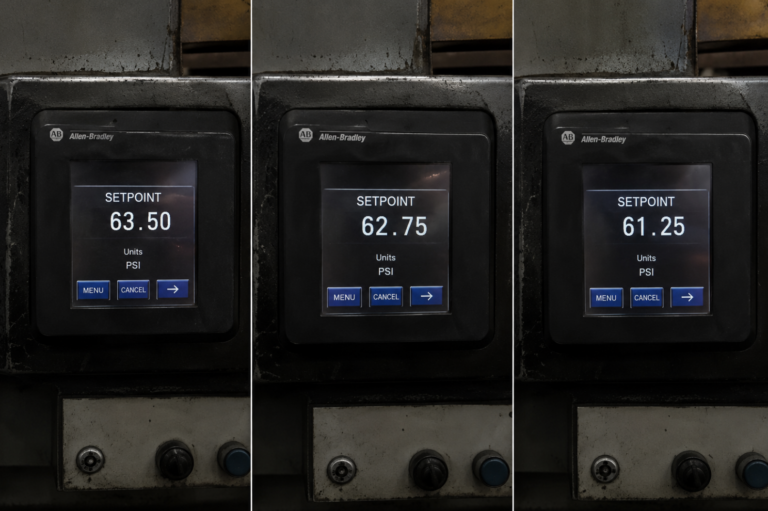
- Capture the real setpoints. Not the control plan, not the SOP. Walk to the machine and read what is actually on the HMI for each operator who runs it. Write down every parameter that an operator can adjust: temperature, pressure, speed, feed, dwell.
- Capture first-pass yield per operator over one full shift each. Count good parts and reworked or scrapped parts at the operator level, not the line level. This is the step most plants skip, and it is the one that turns opinion into evidence.
- Find the winning number. Line up the setpoints against the yields. One operator’s combination will produce the best first-pass result. That combination is your real standard. It has been there the whole time, undocumented.
- Write it down and validate it with the operators. Bring the operators together, show them the numbers, and agree on the setpoint that wins. Update the SOP to specify it, not just the range. Then watch the next few runs to confirm the others can hit it.
That is it. No software required. The output is a single procedure that captures what your best operator already knows, made repeatable by everyone else.
When you have more than one procedure that matters
The catch is obvious the moment you run the exercise: you do not have one part number, you have dozens, and the winning knowledge is scattered across the people who run them. Doing this once, by hand, is a good afternoon. Doing it across the procedures that actually drive your quality and throughput is a program.
That program is what we built the SenseiLab SOP Sprint to run. In 30 days, on your floor, working next to your operators, we capture the real process for the five to ten procedures that matter most, validate the winning standard with the people who run it, and put it where the work happens. The five-minute version is the exercise above. The Sprint is the scaled version, done across your operation and left behind as a living asset your team maintains.
The variability is real. The undocumented standard is real. The cost hiding in the gap between them is real, right up until someone finally watches the work and writes down what wins.
If you want a second set of eyes on where your real standards are living, book a free 30-minute SOP Readiness Diagnostic: senseilab.io/book-a-call
